![Warchest_LogoOptions_1v5-1.png]](https://support.mywarchest.com/hs-fs/hubfs/Warchest_LogoOptions_1v5-1.png?height=50&name=Warchest_LogoOptions_1v5-1.png)
Before You Begin
Reports in Warchest allow you to quickly generate summaries and visuals of your campaign’s financial data. Depending on the size of your dataset, reports may take a few minutes to generate and download. Always choose the appropriate date ranges and formats to get the most useful output for your needs.
Types of Reports
Dashboard Report
- Go to Generate Report.

- Select Dashboard Report.

- Wait for the file to generate (download times vary by data size).
- The Dashboard Report includes all the graphs from your dashboard, making it easy to share visuals with your campaign team.

Profit & Loss Statement
- From Generate Report, select Profit & Loss Statement.

- Choose a custom date range to define the period for your report.

- Download the file.
The report includes:
- Starting and ending cash on hand (for the selected dates)
- Total disbursements
- Total contributions
- Net income
- An itemized breakdown of disbursements by line item
- A list of contributions by source and subcategory

Budget Percentage Report
From Generate Report, select Budget Percentage Report.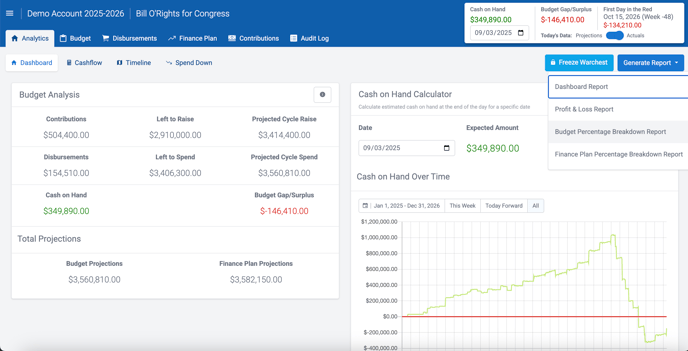
- Choose a date range.
- Select how to group data: Week, Month, Quarter, Year, or All Time.
- Choose page orientation: Portrait or Landscape.
- (Optional) Include a Cash Flow Report.
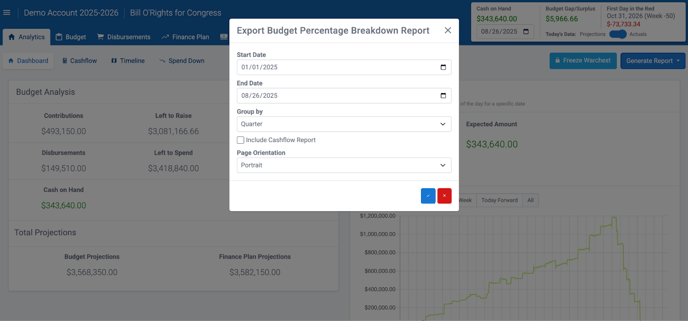
- Download the file.
The report includes:
- Spend by period (e.g., quarterly)
- Spend by period (e.g., quarterly)
- Percent of budget spent
- Budgeted vs. earned totals
- Department-level breakdowns with percentages and line-item details

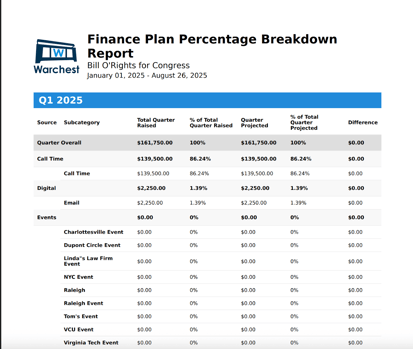
Finance Plan Percentage Report
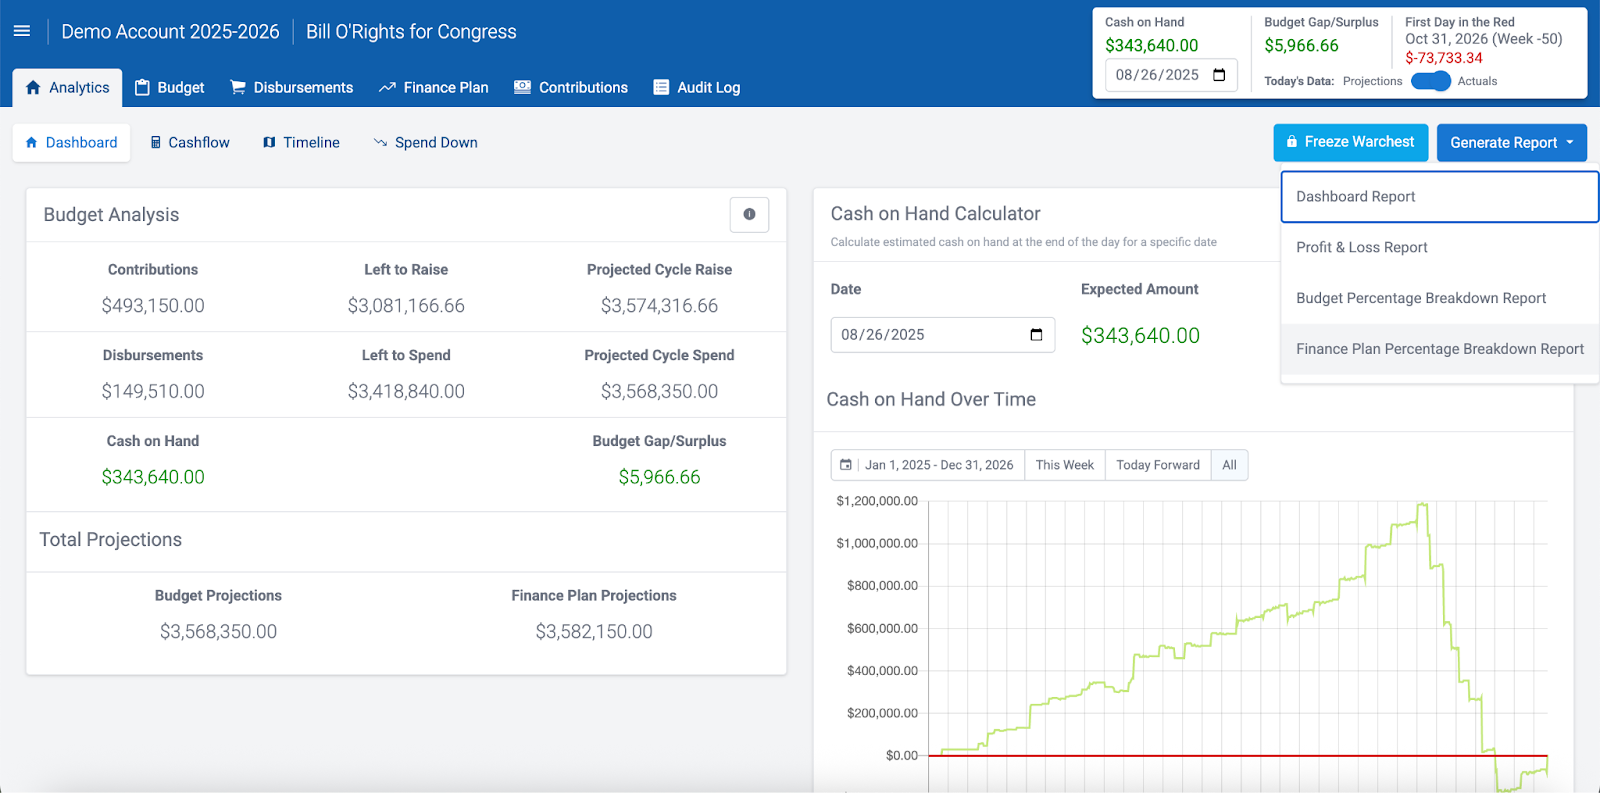
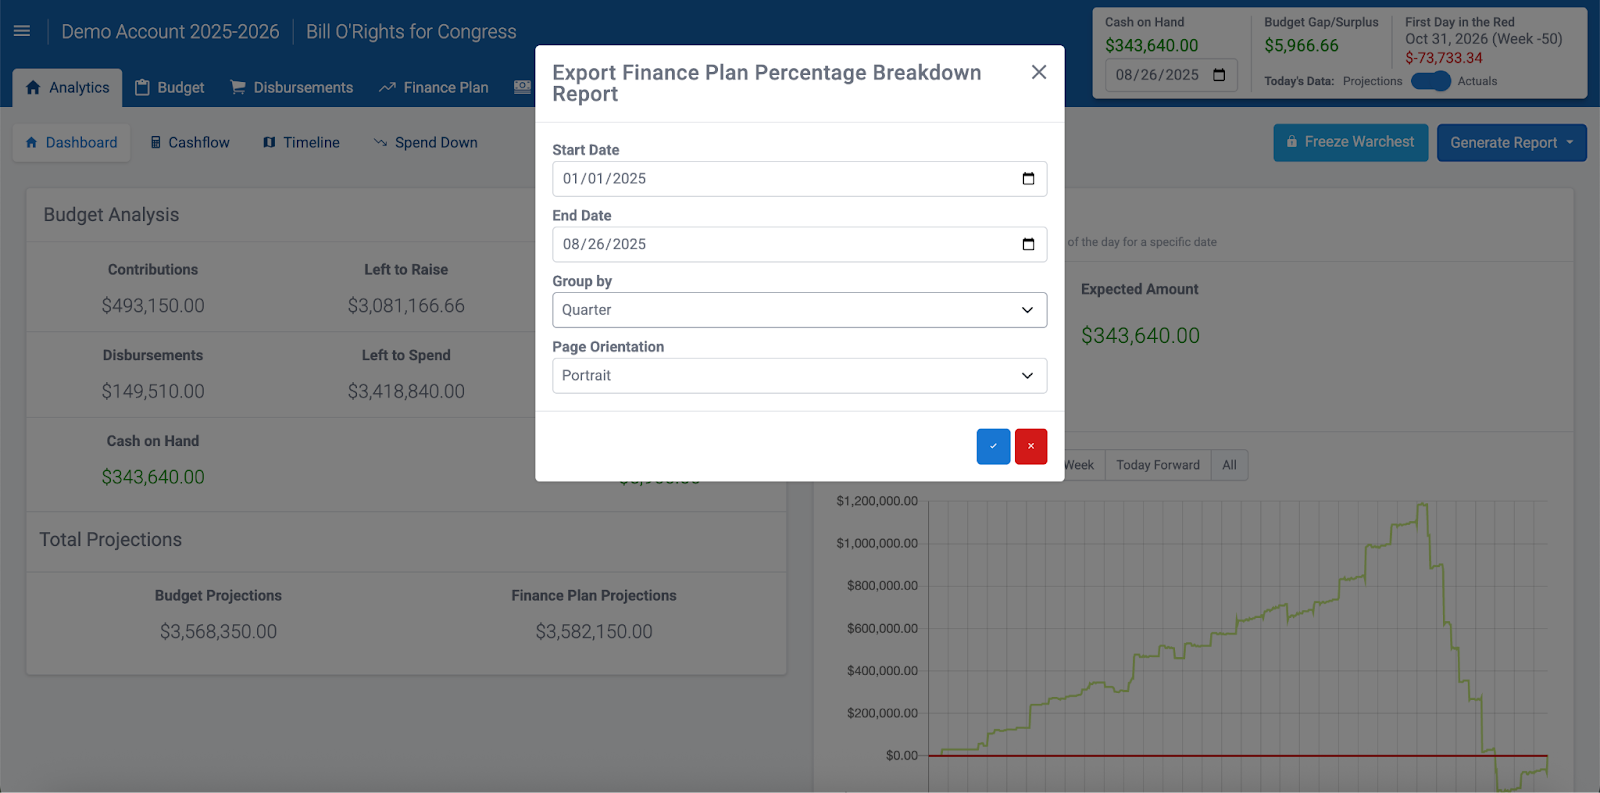
- From Generate Report, select Finance Plan Percentage Report.
- Choose a start and end date.
- Select display: By Week, Month, Quarter, Year, or All Time.
- Choose page orientation: Portrait or Landscape
- Download the file
The report includes:
- Total raised during the selected period
- Percentage of total raised
- Period projections and percentage of projections met
- The difference between actual raised and projected raised
- A breakdown by source and subcategory
Best Practices
- Be mindful of date ranges. Use custom ranges to avoid pulling unnecessarily large reports.
- Group data appropriately. For high-level planning, group by quarter or year; for more granular tracking, use weekly or monthly.
- Choose orientation wisely. Landscape is often better for wide reports with many columns.
- Share visuals. Dashboard Reports are especially useful for sharing with campaign teams.
- Expect wait times. Larger datasets will take longer to generate — allow the report to fully process before downloading.